See What the
Stain
Hides.
CYTOISED applies physics-based spectral analysis to histopathology—delivering automated nuclear segmentation, biomarker quantification, and lesion grading without stain-dependent training data.
The Problem: Every Lab Stains Differently
Staining protocols vary between labs, scanners, and technicians—creating 25–40% inter-observer variability in complex grading. Deep learning tools trained on one lab's stains fail on another's, requiring $500K+ per tumor type to retrain.
"CYTOISED reads the physics of the tissue, not the color of the dye."
Why AI Pathology Tools Fail
Deep learning models trained on one staining protocol collapse when transferred to a different lab's preparation.
Automated Cell Detection
9 segmentation methods—from classical watershed to physics-based ISED to deep learning ensembles—with automatic method selection based on tissue type and stain quality.
Clinical Scoring
Built-in biomarker quantification: Ki-67 proliferation index, H-score, Allred score, Gleason grading, Nottingham grading—exportable to CSV, Excel, or PDF.
How It Works
Three physics-grounded steps. No retraining. No black boxes.
Decompose
Each pixel is separated into spectral opponent channels—isolating nuclear stain (hematoxylin) from cytoplasmic stain (eosin) using physics, not learned patterns.
Segment
Nine detection methods—from watershed to ISED to deep learning ensembles—are automatically selected based on tissue type and stain quality.
Score
Clinical biomarkers—Ki-67, H-score, Allred, Gleason—are computed and exported automatically. Every result is fully interpretable.
Scientific Validation
+17% Stage 1 Cancer Detection
ISED-based spectral analysis detects early-stage malignancies that conventional thresholding methods miss, with documented improvement in Stage 1 detection rates.
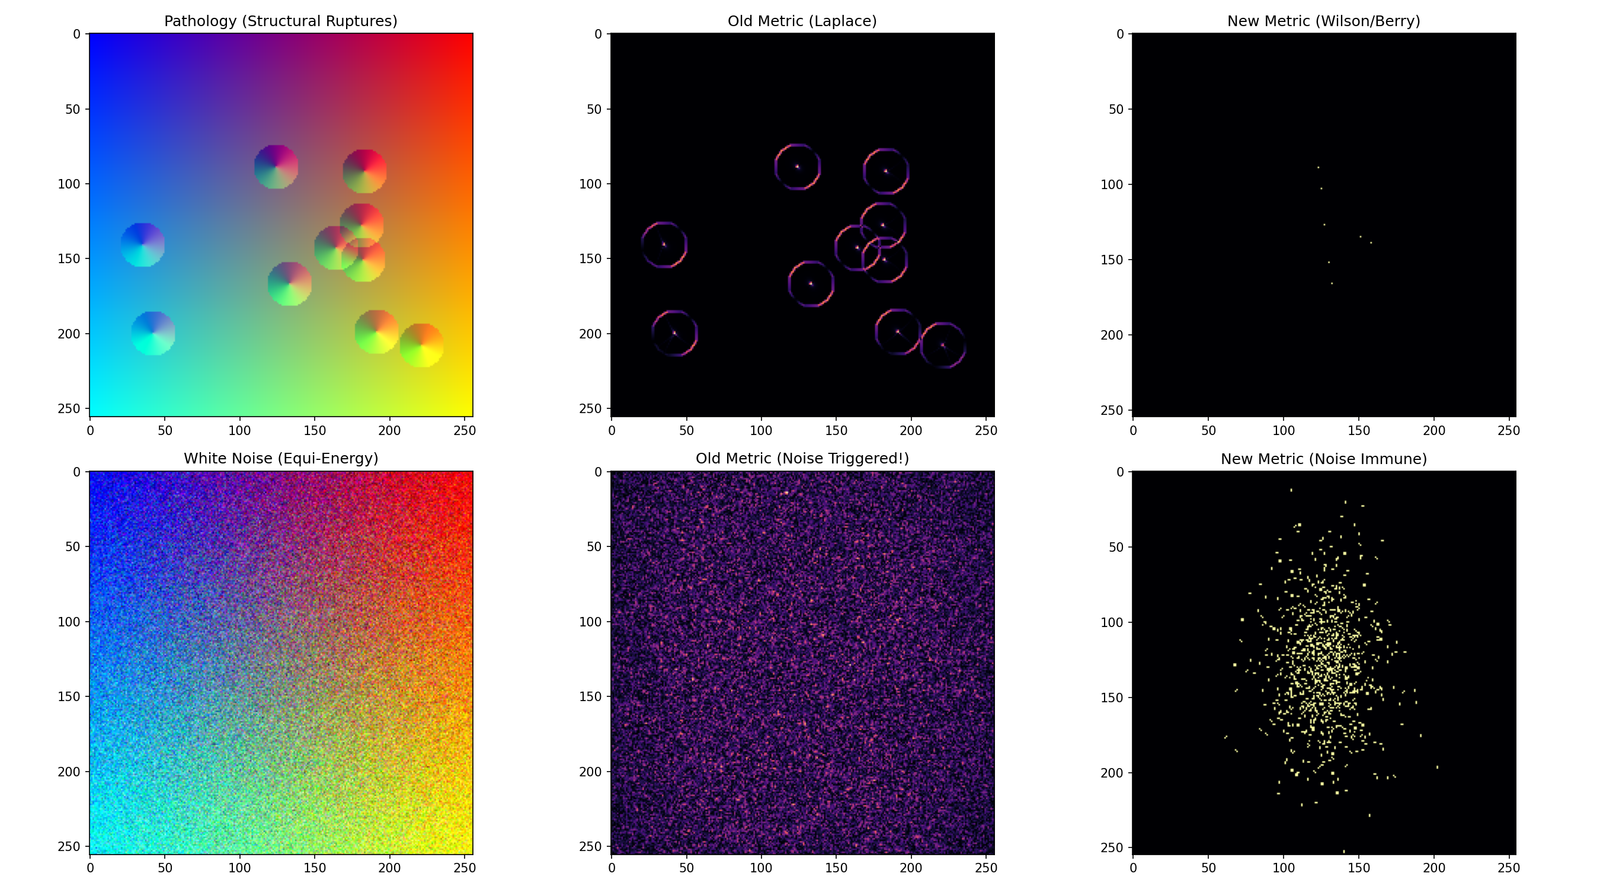
+44% Edge Preservation
Nuclear boundary detection achieves 44% better edge preservation over standard Otsu thresholding, critical for accurate morphometric analysis and grading.
How We Compare
| What We Measure | AI-Only Tools | CYTOISED | Why It Matters |
|---|---|---|---|
| Retraining Per Stain | $500K+ per tumor type | None Required | 5 stain protocols supported out of the box |
| Early Cancer Detection | Baseline | +17% Stage 1 | Documented improvement in detection rates |
| Nuclear Edge Preservation | Otsu thresholding | +44% Better | Critical for accurate morphometric grading |
| Explainability | Black box | Fully Interpretable | Every operation has physical meaning—regulatory advantage |
Stain Normalization
Supports H&E (Ruifrok, Macenko, Vahadane), Pap, and Trichrome—standardizing across labs and scanners.
Biomarker Quantification
Ki-67, H-score, Allred, mitotic count, N:C ratio—12+ clinical metrics, export-ready.
Tumor Microenvironment
Spatial analysis with Voronoi density, clustering index, and tumor-stroma ratio mapping.
CYTOISED in Action
H&E ANALYSIS DEMO
Bring CYTOISED to Your Lab
CYTOISED is built on validated mathematics and ready for research collaboration. Whether you're a pathology department, a diagnostics company, or a research institution — we're looking for partners to help bring this technology to clinical practice.